Stop Staring at Spreadsheets: How We Build a Power BI Dashboard That Works
From STAR schema modeling to drill-through functionality, learn the exact backend features that make a Power BI dashboard work.
From STAR schema modeling to drill-through functionality, learn the exact backend features that make a Power BI dashboard work.
Let’s be honest: your organization doesn't have a data problem. You have plenty of data. You likely have sales figures in your CRM, production yields in your ERP, and employee retention metrics living in a specialized HR platform.
The real problem is a lack of clarity.
When you need to make a fast operational decision, you usually have to pull manual exports, run complex VLOOKUPs across multiple spreadsheets, and try to stitch the narrative together yourself. By the time the report is finally generated and sitting on your desk, the data is already outdated.
You don't need another static report. You need a centralized environment that makes your data instantly actionable. Here is exactly how we engineer Power BI dashboards to do the heavy lifting for you.
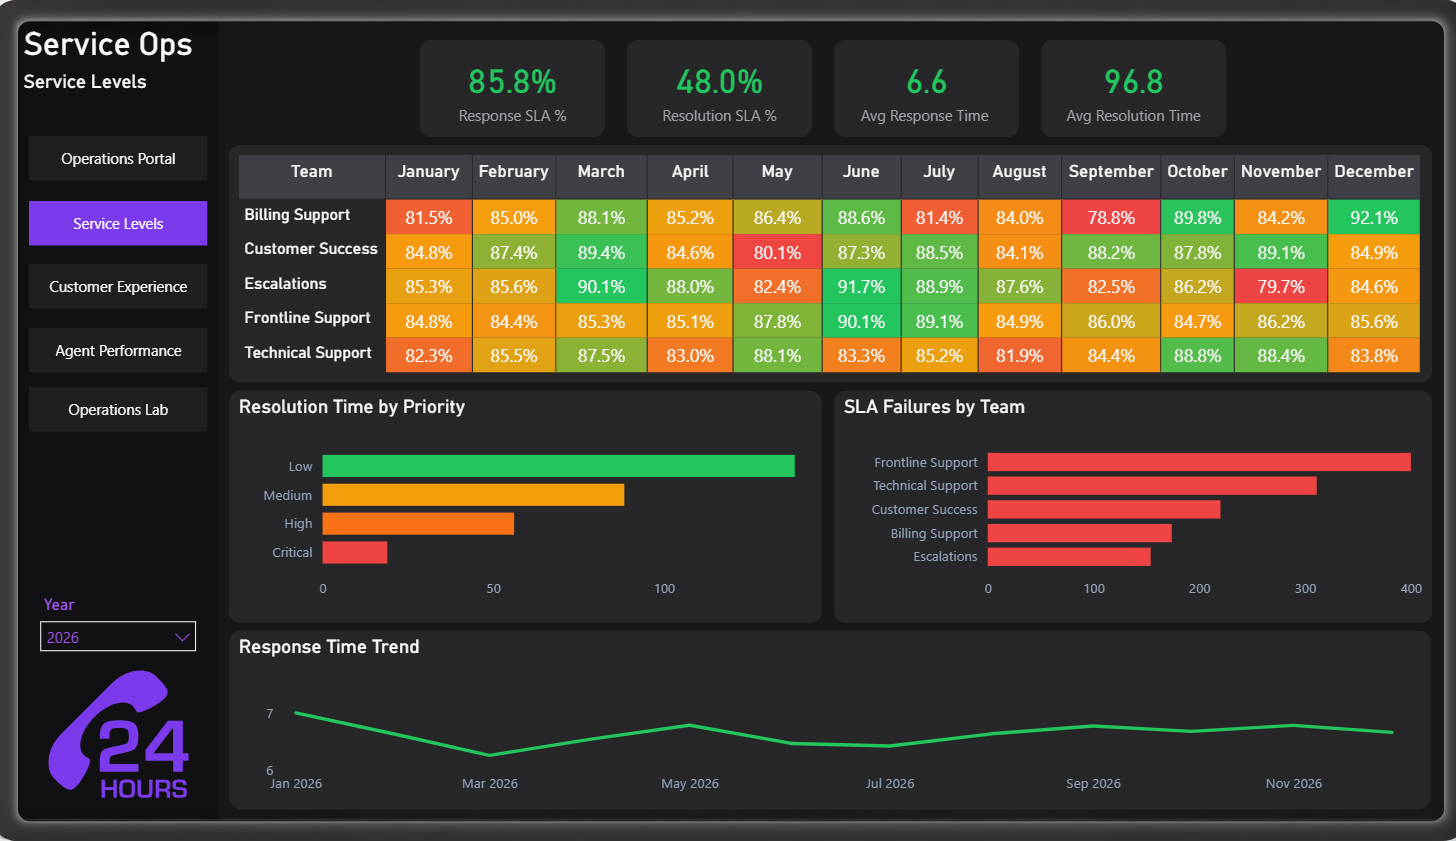
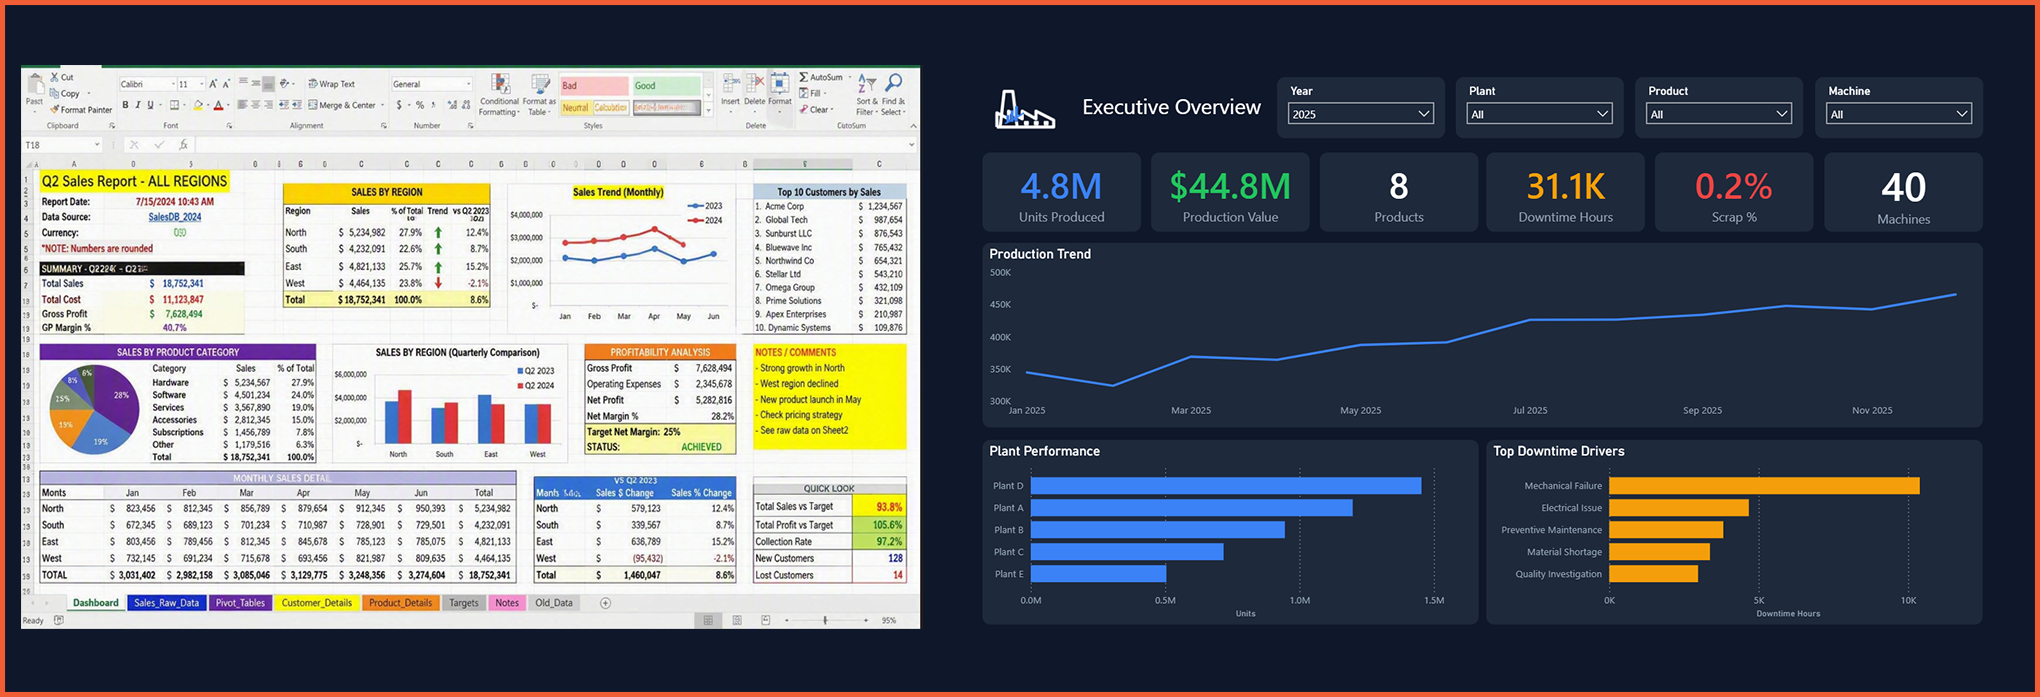
A dashboard is only as valuable as the immediate decisions it helps you make. If your current dashboard is just a digital version of an Excel spreadsheet, you are missing out on the core advantages of modern analytics.
Here is the difference between a standard reporting tool and a properly engineered Power BI environment:
Creating a beautiful chart is easy. Building a functional, high-performance Power BI dashboard requires mechanical precision in the backend. When we build out a reporting environment, these are the critical structural features we deploy to give you total control over your data.
A dashboard will crash and burn if the foundational data structure is flawed. We utilize a specific architecture called STAR Schema Modeling. Think of this as the concrete foundation of your house. It allows you to seamlessly filter and aggregate data across completely different datasets using unified columns.
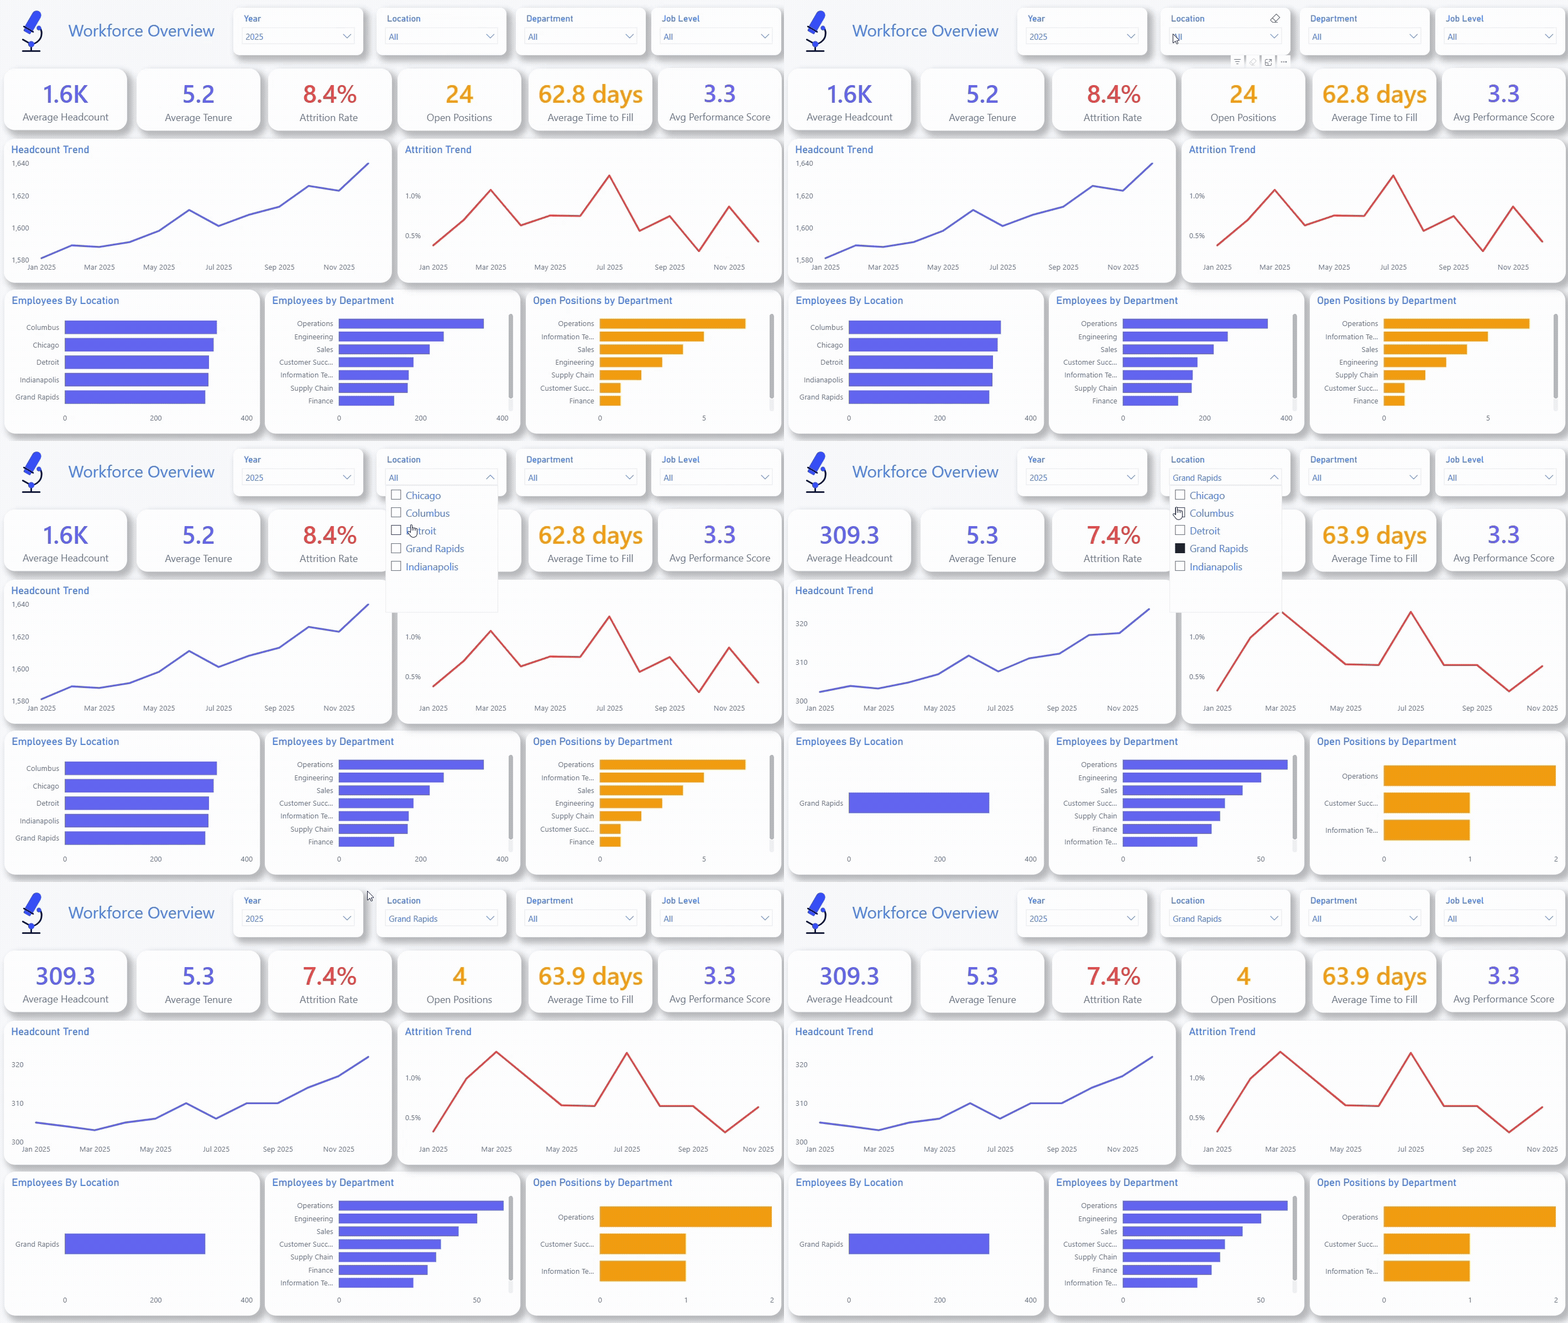
Top-level metrics are great for a high-level overview, but what happens when you spot an anomaly? You shouldn't have to leave the dashboard to find out why a number is dropping.
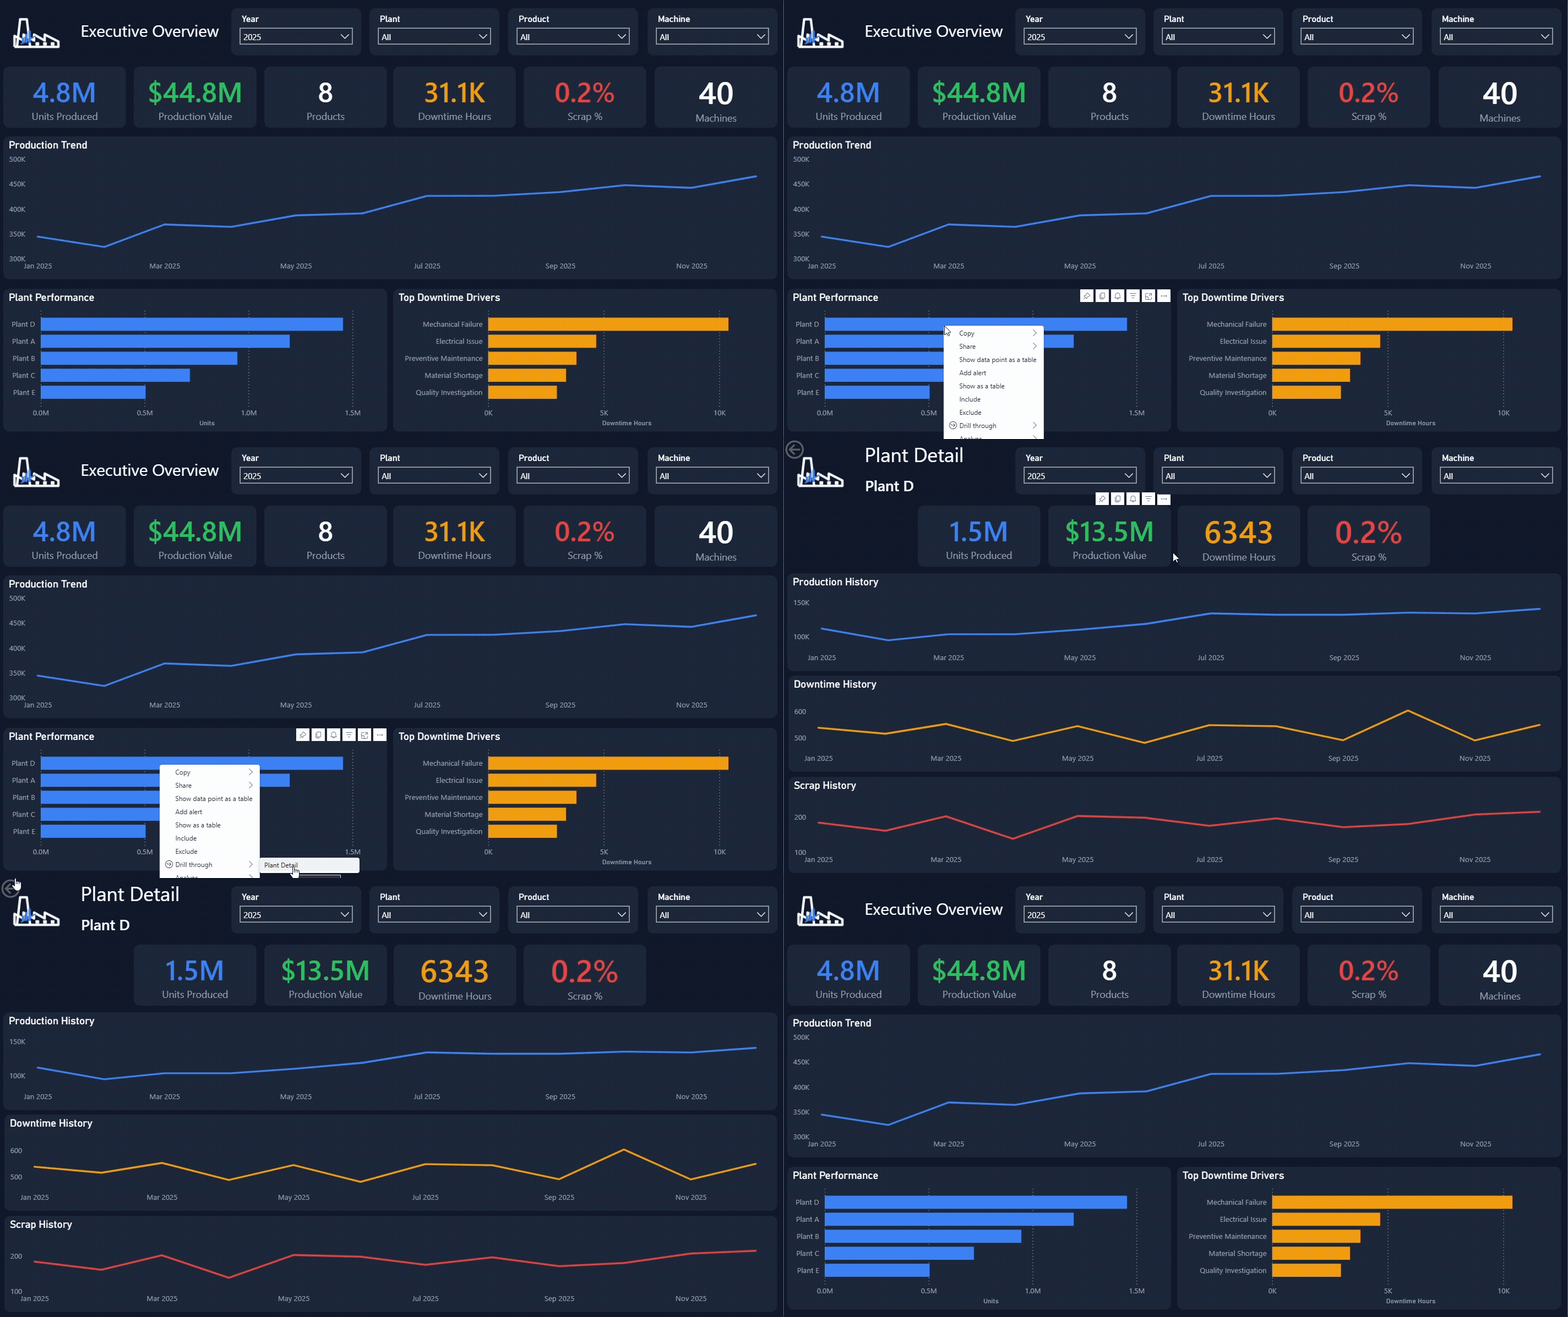
Your data should tell you what needs attention before you even read the individual numbers. We build insight mechanics that strip away the noise and highlight exactly what matters.
You shouldn't need a training manual to navigate your own data. A well-built dashboard guides you through the analysis naturally.
Connecting a data source to a chart is not enough. To truly gain a competitive advantage, you need structural engineering and a strategic understanding of how your team truly consumes information.
As a Microsoft Solutions Partner, Elevate Technology Partners builds the infrastructure that turns fragmented data into clear, immediate, and actionable intelligence.
Elevate Technology Partners LLC
5496 Glenwood Hills Pkwy SE,
Grand Rapids, MI 49512
(616) 202-6518